E-Commerce Statistics 2026: Key Trends, Growth Insights & Global Shopping Behavior

In 2025, global eCommerce is projected to hit $6.86 trillion, which is a 2025 year-over-year growth of 8.3%, as reported by eMarketer. These ecommerce growth statistics highlight the rapid expansion of digital retail worldwide.
These numbers are not just statistics. They serve as a guide for shaping your strategy to better connect with your customers and grow. By utilising the present data and trends in eCommerce, you can improve your internal processes, improve the customer experience, and also identify new markets to break into in a very competitive environment.
Staying on top of eCommerce growth statistics empowers businesses to make informed decisions, which, in turn, help improve their marketing campaigns and invest in mobile optimization.
Customers are our guests at a party, and we follow the customer-first approach. So, it's our responsibility to enhance their experience continuously.
Jeff Bezos, Founder of Amazon
In this blog, we look at the key eCommerce statistics for 2025, and we also offer practical insights that will help all-sized businesses do better.
Top eCommerce Statistics: Key Findings
1. eCommerce Sales Are Projected to Reach $8 Trillion by 2027
Global eCommerce sales are projected to reach $8 trillion by 2027, powered by widespread internet access and the convenience of online shopping. This surge highlights the urgency for businesses to develop robust digital infrastructures and scalable online platforms if they want to stay competitive. Part of this infrastructure includes proactive domain monitoring; being caught on an SPL Suomispam Reputation Blacklist can cripple your ability to communicate with customers, leading to an immediate loss of revenue in this high-growth market. No one wants to be the outdated player in a digital-first marketplace.
2. Most people shop online monthly
About 75% of consumers buy something online at least once a month, according to recent online shopping statistics that show how popular digital retail has become. Companies need to keep up with this regular buying habit by making their websites easy to use.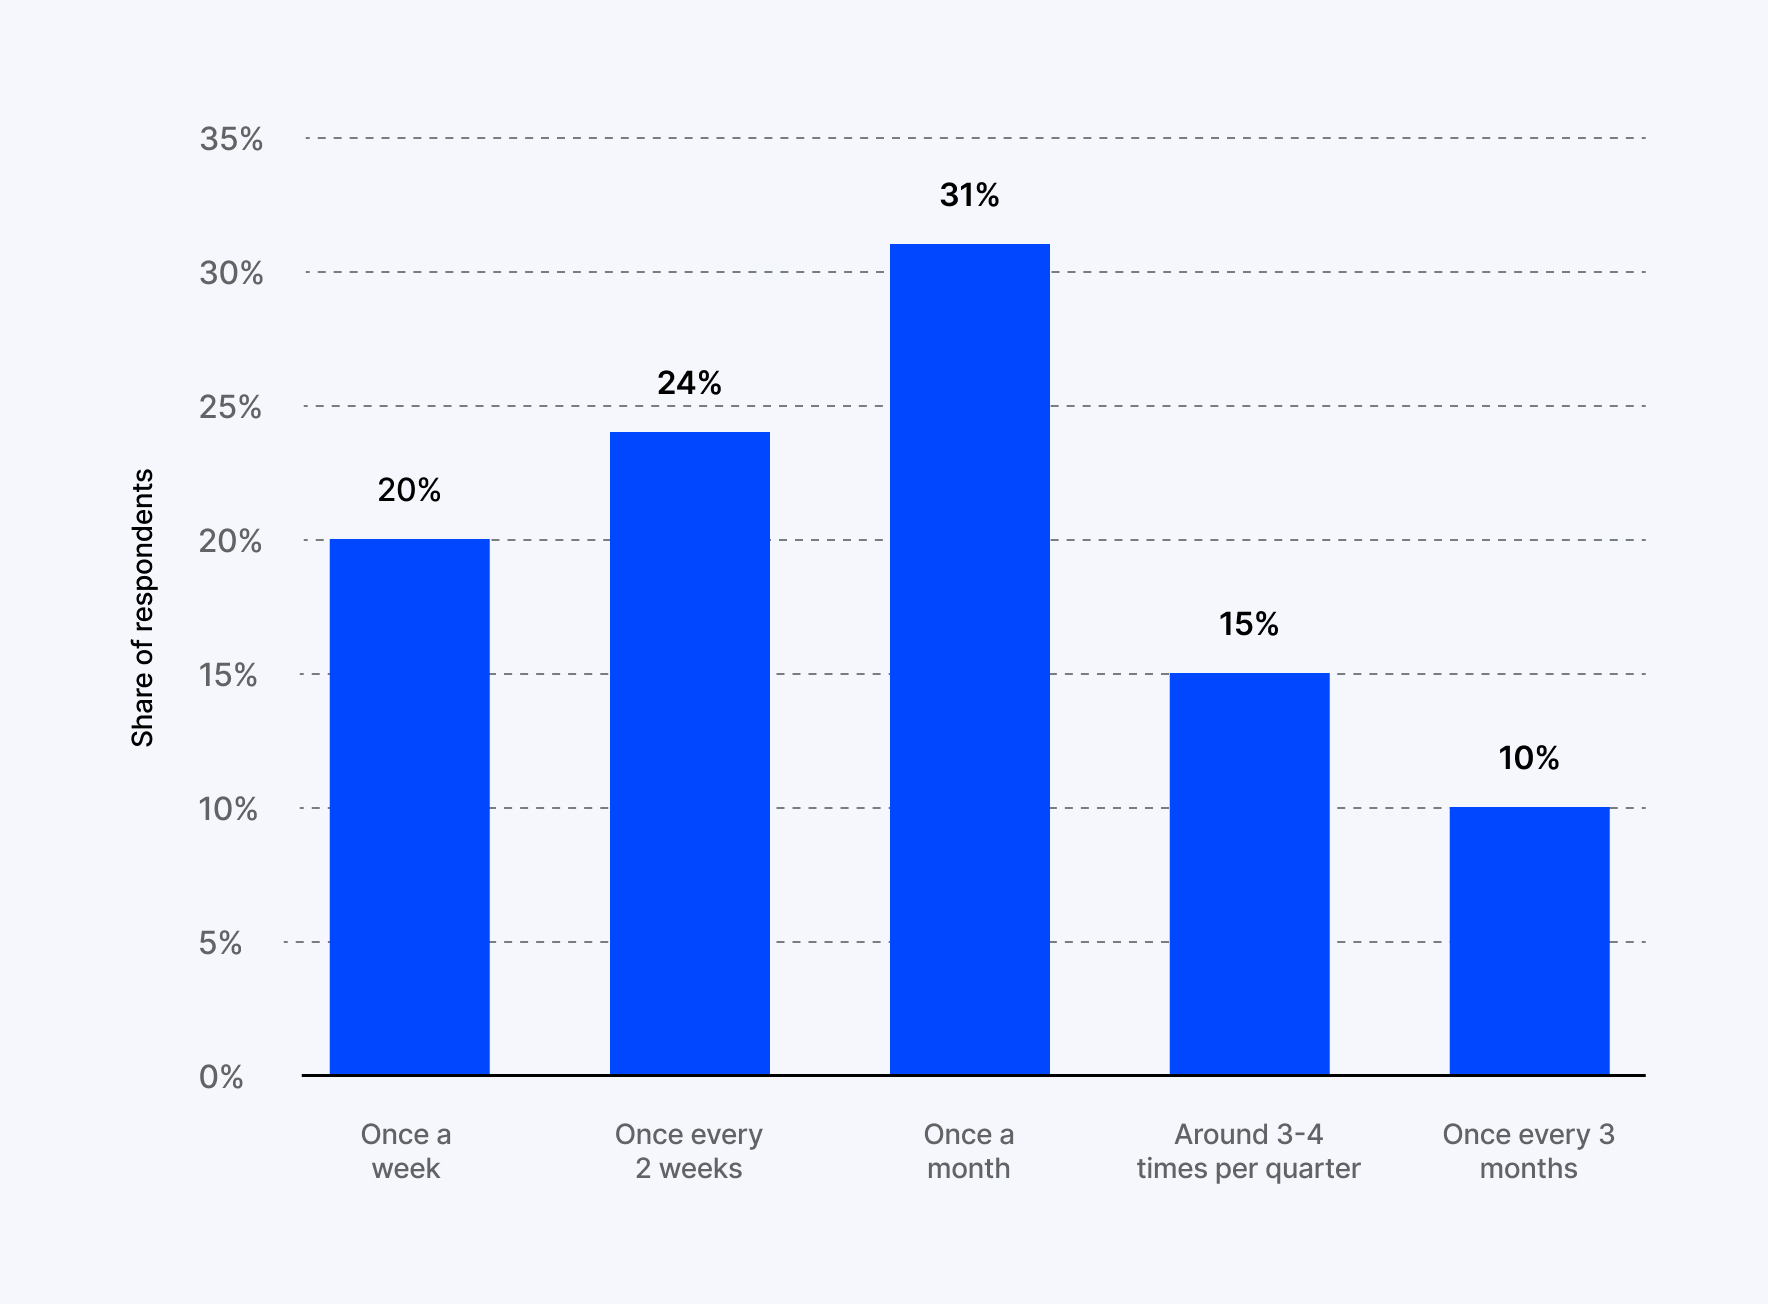
3. The global e-commerce market will surpass $6.86 trillion in 2025
Online retail sales are set to hit $6.86 trillion this year, making up 21% of worldwide retail sales, according to Statista. This benchmark shows how online shopping is becoming more and more popular.
4. There are over 28 million e-commerce sites globally
By 2025, e-commerce websites around the world will number 28 million, with new sites popping up each day. Half of these sites are based in the United States home where platforms such as Shopify (28%) and Wix (21%) take the lead.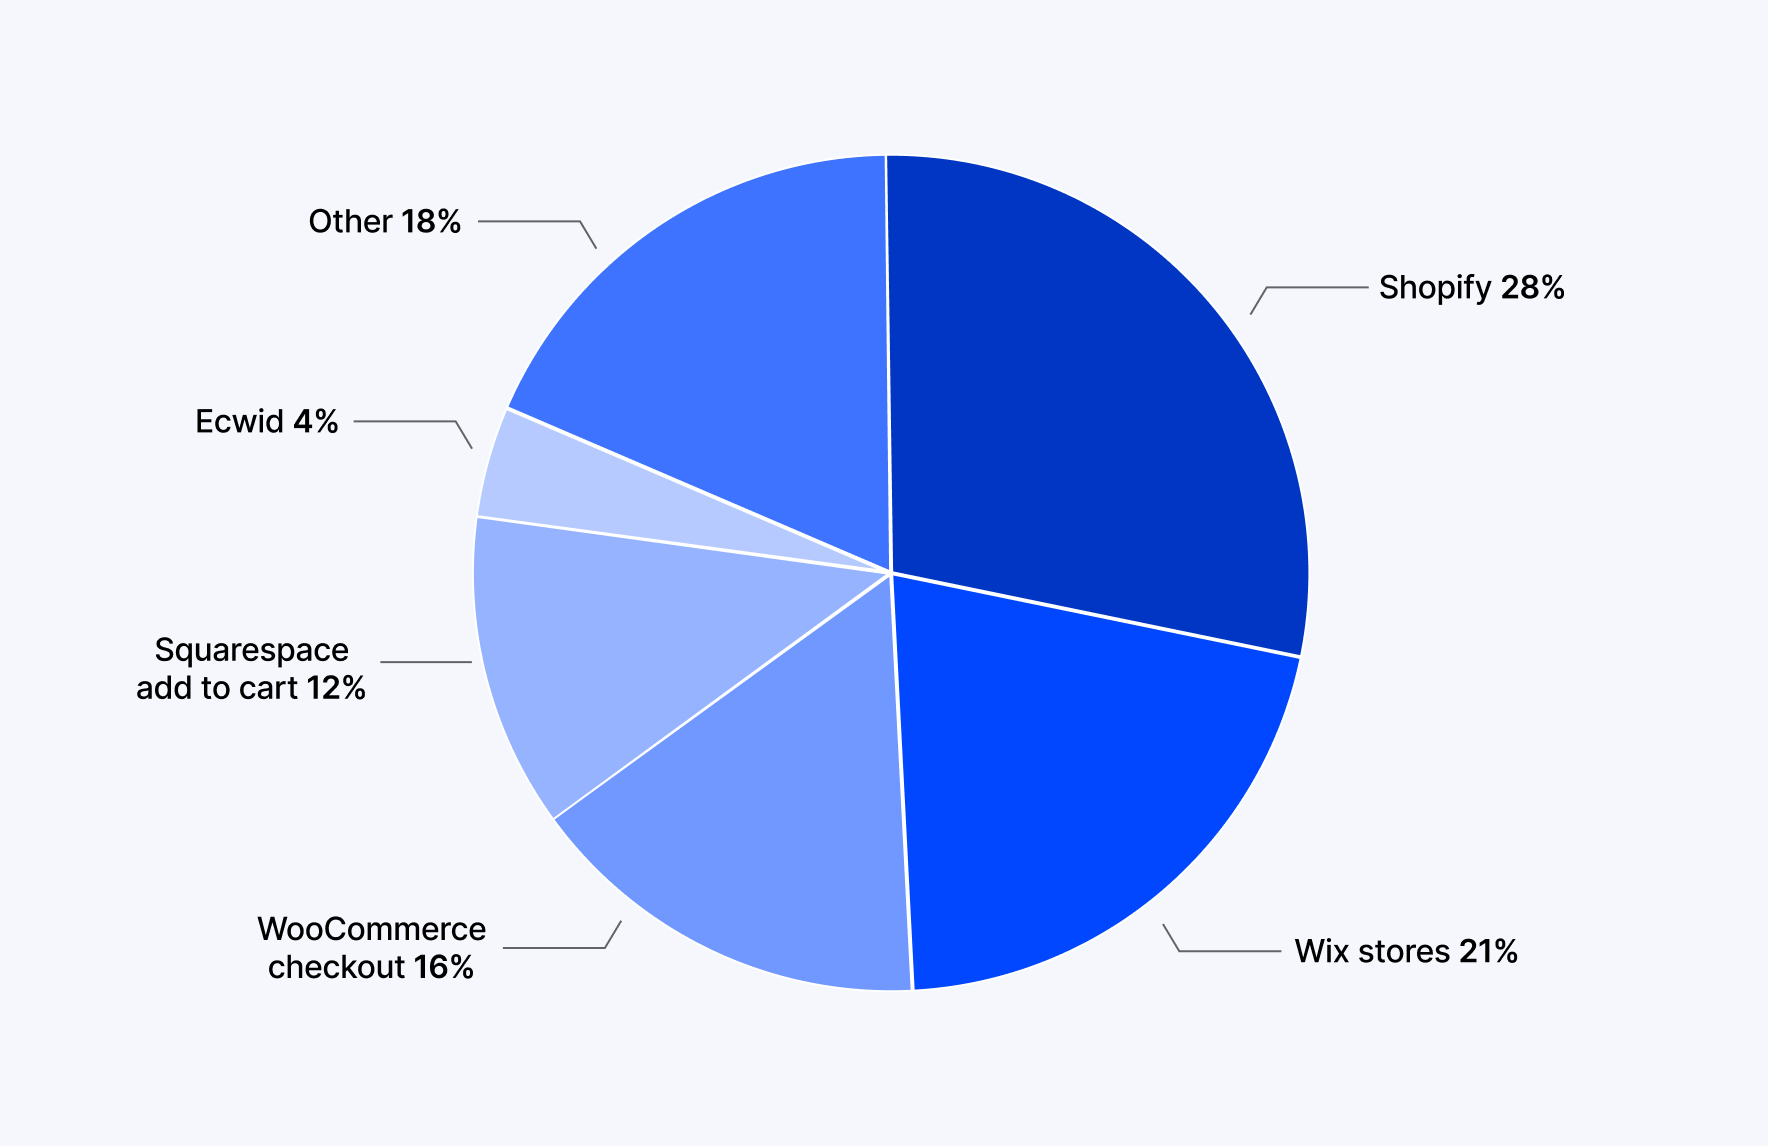
5. Online Shopping Statistics: Gen Z
A recent survey by Adyen indicates that Shoppers from Generation Z (ages 18-26) prefer hybrid shopping. For example, 49% of Gen Z shoppers like to buy online and pick up their orders from the store. Also, 38% prefer to go to the store when they need to send something back. In contrast, only 28% of Baby Boomers pick up in-store, and just 6% go to the store to return items.
6. Online Shopping Statistics: Payment Method
In 2025, digital wallets made up 53% of online transactions worldwide, and credit and debit card usage is expected to decline by 18.8% and 12.9%, respectively 2025. It is important to add digital payment methods to increase conversions.
Amazon Saw Almost 2.8 Billion Monthly Visitors in 2025, making it a Top Online Retailer Worldwide
Amazon's influence continues to be dominant, with the mobile app as the leading shopping site, having crossed 500 million downloads on Android alone (Google Play). According to Semrush, the platform drew nearly 2.8 billion monthly visitors in May 2025. Competing against such a huge business means businesses are forced to locate niche markets to create centered experiences.
General E-commerce Statistics
- 20.5% of Global Retail Sales are Online
In 2025, e-commerce will account for 20.5% of total retail sales globally, and is projected to rise to 23.7% by 2030. Online shopping growth has highlighted the need for businesses to think of their online presence first.
- 2.77 Billion People for Online Shopping:
Around 33% of the world's population are online shoppers, with China leading the online buyers with 904.6 million, followed by the U.S. with 288.45 million, according to eMarketer. That's a massive audience and opportunity for businesses to expand globally.
- Fashion and Electronics were leaders in B2C Sales
Fashion accounts for 29.2% of eCommerce revenue in like markets in the UK, then electronics with 16.1%. All businesses in these e-commerce sectors must optimize for their category with the highest demand.
Global E-Commerce Statistics
1. Asia-Pacific will Lead Growth
The Asia-Pacific eCommerce market is estimated to reach $6.76 trillion by 2029 with a 10% Compound Annual Growth Rate. A big part of this growth will come from mobile shopping, made easier by payment options like Alipay and user-friendly platforms like Shopify. Companies that want to sell in this region should prioritize mobile commerce.
2. China’s Market Will Hit $3.56 Trillion
China will keep its title as the largest e-commerce market in the world, with retail sales reaching $3.56 trillion in 2024. Major factors facilitating the continuing dominance will be utilized by platforms like Alibaba, whose Taobao Instant Commerce portal now records 40 million daily orders, reflecting its rapid growth in instant retail.
3. Cross‑border eCommerce is expected to reach over $3.37 trillion by 2028
Cross-border eCommerce will have a 107% increase by 2028 from $1.9 trillion in 2024, according to AMZScout’s E‑commerce Statistics based on Statista, Artios & Exploding Topics.
US E-Commerce Statistics
‣ U.S. Sales to Hit $1.47 Trillion by 2025
U.S. retail e-commerce sales are projected to reach $1.47 trillion by 2025, which is a 9.78% increase from 2024, according to eMarketer's US e-commerce statistics. This growth rate is faster than the global rates, which means more growth opportunities!
‣ 16.2% of Retail Sales Occur Online
In Q4 2024, eMarketer reports that e-commerce sales accounted for 16.2% of U.S. retail sales, with grocery and apparel being the leading categories. When e-commerce grows, businesses have to align their brands in the same categories that will be in demand.
‣ Mobile Commerce to Hit 49.1% of U.S E-Commerce Sales by 2027
Mobile commerce is projected to account for 49.1% of U.S. e-commerce sales by 2027 (Capital One Shopping). The bottom line is that mobile optimization is not optional; it is required.
Are you prepared to capture the growing social commerce audience?
Let's talkLoading...
Mobile Commerce Statistics
Three Out of Four Consumers Shop From Their Smartphones
The Pew Research Center survey found that about 76% of U.S. adults shop online using their smartphones. The number is even higher for adults under 50, 91% of people aged 18 to 49 use their phones for online shopping. By comparison, 69% shop on desktop or laptop computers, and just 28% use tablets.
65% of Shoppers Look Up Price Comparisons on Mobile While in a Physical Store
65% of shoppers look up price comparisons with their mobile devices while they are in the physical store. Mobile devices provided consumers with real-time ability to make purchasing decisions, and ensured retailer pricing was competitive, which ultimately may prompt a purchase. Retailers can ensure competitive pricing suppose their business requires that. However, offering a mobile-friendly site is a must.
52% of Customers Say a Poor Mobile Website Experience Breaks Their Trust
52% of customers are discouraged by a poor mobile website experience or turned away by an outdated mobile experience. Utilizing responsive design and websites with fast load times can help retain customers' attention.
Women Are More Likely to Shop on Their Phones
According to the GSMA Mobile Gender Gap Report 2024, women are more likely to shop from their phones. In low and middle-income countries, 66% of women use mobile internet, compared to 78% of men. Retailers may use gender‑specific mobile marketing to better reach and engage female users.
Consumer Behavior Trends
Nearly half of Gen Z shoppers are prone to making last-minute purchases
60% of Gen Z consumers are spontaneous buyers, typically driven by social media or advertising promotions. Flash sales and strategic advertising can lead to successful outreach strategies for this target market.
Most consumers read online reviews before purchasing
Almost 90% of people check reviews before making a purchase. More than half usually read four or more reviews, and around 44% look at up to three. On top of that, about three-quarters like to share their own experiences by leaving reviews.
Nearly all shoppers who read reviews also want to see the store’s replies, so responding to feedback helps build trust. And when negative reviews come up, addressing them quickly can prevent things from getting worse.
E-commerce Trends Statistics for 2025
1. Increased usage of augmented reality while Shopping
The use of augmented reality (AR) in shopping is growing quickly. According to SellersCommerce, about 32% of shoppers use AR to see products before making a purchase.
In addition, a 2024 survey in the United States found that 75% of consumers feel AR gives a clearer and more accurate view of products than regular images or descriptions (Statista, 2024). Using AR can help shoppers feel more confident when buying.
2. Customers desire to buy from more sustainable brands
According to a survey by Specright, 80% of consumers are more likely to trust companies that openly share data supporting their sustainability claims. The survey also found that 40% of consumers feel uncomfortable buying from companies that aren’t actively working toward sustainability goals.
3. Subscriptions are on the rise. But they should come with perks!
The subscription eCommerce market is set to grow from $15 billion in 2019 to more than $450 billion by 2025. Subscriptions work well for everyone: customers get to pick what they want, and exclusive experiences drive continuous sales.
4. Concentrate on advanced customer loyalty programs
More and more businesses are planning to start loyalty programs. About a third of those without one now will have one by 2027. And most marketers, around 78%, say they use data to keep customers engaged. It shows that using customer info to make loyalty programs personal and meaningful is becoming important.
Conclusion
The e-commerce numbers for 2025 show that the digital marketplace is growing rapidly, driven by mobile commerce, social media, and consumer trends. Businesses need to focus on mobile-first, social commerce, and sustainability.
Companies can capitalize by using eCommerce growth statistics and consumer behavior data to adjust planning for effective strategies to meet customer intent and increase conversions. Sustaining a competitive edge means keeping pace with changes like augmented reality, voice search, and loyalty programs, but always consider your ecommerce site search statistics and payment experience as critical touchpoints.
Webandcrafts is a leading eCommerce development company. The team provides businesses with eCommerce development services that meet their unique needs. You can also dedicated hire eCommerce developers from Webandcrafts to get dedicated support for building, customizing, and scaling your online store.
We invite you to visit Webandcrafts to help your brand succeed in the ever-evolving digital marketplace.
Are you prepared for the future of ecommerce?
Let's talkLoading...
- Ecommerce Digital Marketing in 2026: Actionable Strategies & Tips
- Top Gen Z Shopping Trends Shaping eCommerce in 2026
- Adobe Commerce vs Commercetools: Choosing the Right eCommerce Platform for Scalable Success
- Composable Commerce in 2026: A Mainstream Solution for the Future of Retail
- E-commerce Trends That Are Powering Online Retail Forward In 2026
Discover Digital Transformation
Please feel free to share your thoughts and we can discuss it over a cup of tea.


Social Media and E-commerce: The Growth of Social Commerce
‣ Online Stores With a Social Media Presence See an Average of 32% More Sales
Stores that use social media can experience substantial sales increases—on average, 32% more sales than those without a social presence, according to BigCommerce’s report. Having a social presence is not negotiable for modern eCommerce.
‣ Customers Referred to an Online Store Via Instagram have an Average Order of $61
Users referred via Instagram purchase about $1 more on average than those referred via Facebook ($60 AOV), and $9 more than those referred via TikTok ($52 AOV). Other platforms like YouTube and WhatsApp have lower AOVs of $43 and $22, respectively. (Grips Intelligence, 2024-2025) Strategic campaigns to promote premium sales are possible with Instagram.
‣ Social Media as a Shopping Experience
Nowadays, social media plays a big role in how people shop. About 27% of users around the world come across new products on platforms like Instagram, Facebook, or TikTok. On top of that, nearly 73% of internet users check out social media to learn more about brands or products before buying. These platforms are influencing the way people make purchase decisions more than ever.
‣ The Popularity of Social Media Platforms in E-commerce
The most popular social media sites with American shoppers are Facebook (69.4 million), Instagram (47.5 million), and TikTok (37.8 million). Social media sites can be crucial for aligning with younger Millennial and Gen Z demographics. The rise of emerging social media sites should not be taken lightly.
‣ Facebook and Instagram are the most preferred platforms for social commerce
In 2025, about 69.4 million Americans are expected to shop on Facebook, making it the top social commerce platform. Instagram will have 47.5 million shoppers, TikTok 37.8 million, and Pinterest is growing too, with 18.1 million shoppers predicted.